hina.visualization
Tutorial
The visualization module provides functions for visualizing heterogeneous interaction networks. Users can generate interactive plots that project bipartite networks onto specified layouts, optionally filter nodes based on group attributes, and display community structures with distinct node colors and positions.
Currently, the module contains the network_visualization.py file, which includes:
plot_hina: Visualizes a bipartite network with customizable layout, optional node filtering, and optional edge pruning.
plot_bipartite_clusters: Visualizes a bipartite network with community structure by arranging nodes in a circular layout with colors and shapes that reflect cluster memberships.
plot_hina_projection: Visualizes a projected one-mode network based on the defined nodeset in a constructed HIN with circular layout. The edge weights reflect the similarity of the interaction profiles of the defined nodeset.
Function |
Description |
|---|---|
plot_hina(B, layout=’bipartite’, group_name=[None, None], pruning_kwargs=None, NetworkX_kwargs=None) |
Visualizes a bipartite network with customizable layout, optional node filtering, and edge pruning. |
Visualizes a bipartite network with community structure; nodes are arranged in a circular layout according to cluster assignments. |
|
Visualizes a projected one-mode network based on the defined nodeset in a constructed HIN; Edge weights reflect the similarity of the interaction profiles of the defined nodeset |
Reference
Description: Visualizes a bipartite network using a specified layout. The function optionally prunes edges based on statistical significance if pruning parameters are provided and can filter nodes by a specified group attribute.
Parameters:
- B: A NetworkX graph representing the bipartite network to be visualized.
- layout: A string specifying the layout for node positioning. Options include
'bipartite','spring', and'circular'. Default is'bipartite'. - group_name: A list of two elements, where the first is the node attribute name (e.g.,
'group') and the second is the specific value to filter by (e.g.,'Group 1'). Default is[None, None], meaning all nodes are included. - pruning_kwargs: Optional dictionary of parameters for pruning edges using statistical significance testing. Default is
None(no pruning). - NetworkX_kwargs: Optional dictionary of additional keyword arguments for customizing the NetworkX visualization. Default is
None.
- Returns:
None: Displays the bipartite network visualization.
Description: Visualizes a bipartite network with community structure by arranging nodes in a circular layout. Nodes in the first set are positioned around community centroids while nodes in the second set are arranged inside the circle. Community labels are indicated through distinct node colors and shapes.
Parameters:
- G: A NetworkX graph representing the bipartite network with weighted edges.
- noise_scale: A float controlling the dispersion of nodes in the first set around their community centroids. Default is
3. - radius: A float defining the radius for positioning community centers. Default is
20. - encode_labels: A boolean indicating whether to encode node labels into unique identifiers. Default is
False. - node_labels: Specifies whether to display labels for nodes. This can be
Trueto label all nodes (or a string such as'Both Sets'for customized labeling). Default isTrue. - edge_labels: A boolean indicating whether to display edge weights as labels. Default is
False. - scale_nodes_by_degree: A boolean indicating whether to scale node sizes proportionally to their weighted degree. Default is
False. - node_scale: A float controlling the average node size. Default is
2000. - node_kwargs: A dictionary of additional keyword arguments for customizing node appearance. Default is
{'edgecolors': 'black'}. - edge_kwargs: A dictionary of additional keyword arguments for customizing edge appearance. Default is
{'edge_color': 'black'}.
- Returns:
None: Displays the network visualization with community grouping.
Description: Visualizes a projected one-mode network based on the defined nodeset in a constructed HIN. The projection creates edges between nodes in the target nodeset based on their similarity of interaction profiles with the other node set. Edge weights reflect the similarity of the interaction profiles.
Parameters:
- B: A NetworkX graph representing the bipartite network to be visualized.
- target_nodeset: A string specifying which node set to project ('student' or 'coded behavior').
- layout: A string specifying the layout for node positioning. Options include
'circular','spring'. Default is'circular'. - group_name: A list of two elements, where the first is the node attribute name (e.g.,
'group') and the second is the specific value to filter by (e.g.,'Group 1'). Default is[None, None], meaning all nodes are included. - pruning_kwargs: Optional dictionary of parameters for pruning edges using statistical significance testing before the projection. Default is
None(no pruning). - NetworkX_kwargs: Optional dictionary of additional keyword arguments for customizing the NetworkX visualization. Default is
None. - weight_scaler: A float value to scale edge weights for visualization purposes. Default is
1.0.
- Returns:
None: Displays the projected network visualization.
Demo
Example Code
This example demonstrates how to visualize a heterogeneous interaction network and its community structure.
Step 1: Import necessary libraries
import pandas as pd
from hina.construction import get_bipartite
from hina.visualization import plot_hina, plot_bipartite_clusters, plot_hina_projection
Step 2: Load the example dataset. (The required spreadsheet file example_dataset.xlsx is in the Example_dataset directory.)
df = pd.read_excel("example_dataset.xlsx")
Step 3: Construct the bipartite network representation
B = get_bipartite(df,student_col='student id (student_col)', object_col='codes (obj1_col)', attr_col='code_categories (obj_attribute_col)', group_col='group (group_col)')
Step 4: Visualize the bipartite network for all groups
plot_hina(B, layout='bipartite', group_name = ['group (group_col)', None], pruning_kwargs=None, NetworkX_kwargs=None)
Step 5: Visualize bipartite clustering network with an automatically inferred number of communities
plot_bipartite_clusters(B)
Step 6: Visualize the projected one-mode network of the constructed HIN based on the object_col nodes
plot_hina_projection(B,'codes (obj1_col)')
Example Output
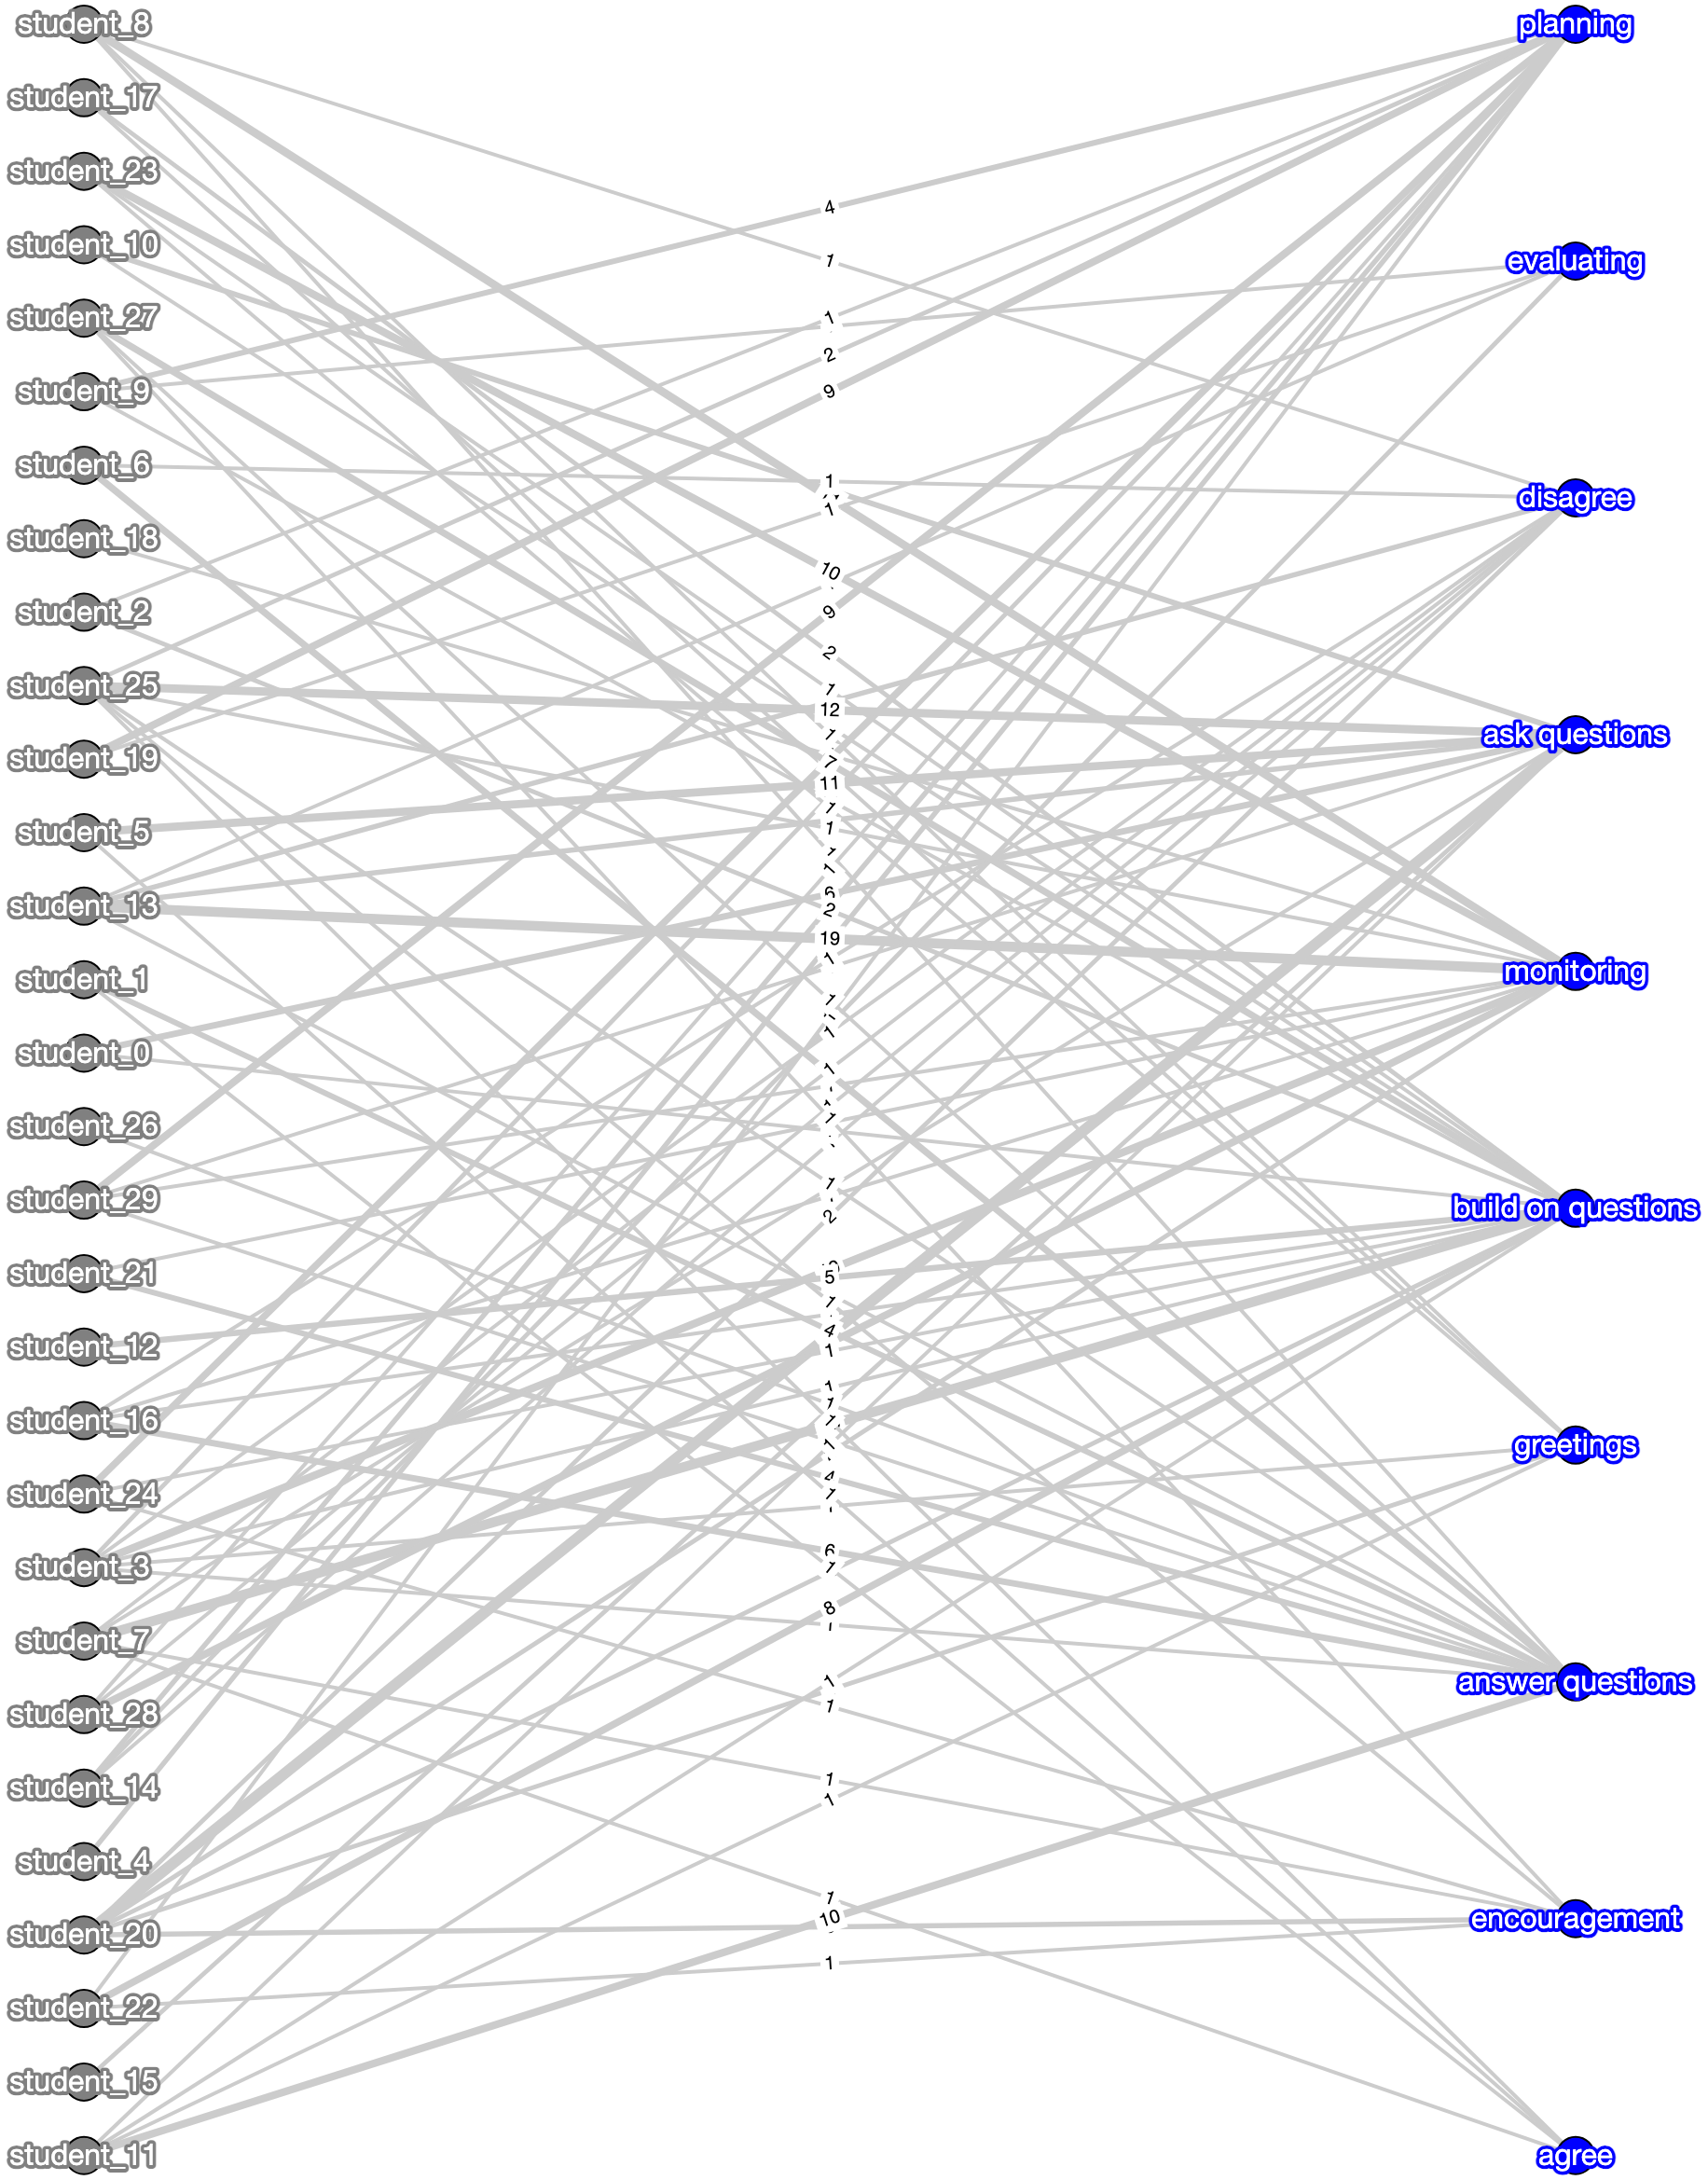
Bipartite network of students and tasks for all groups.
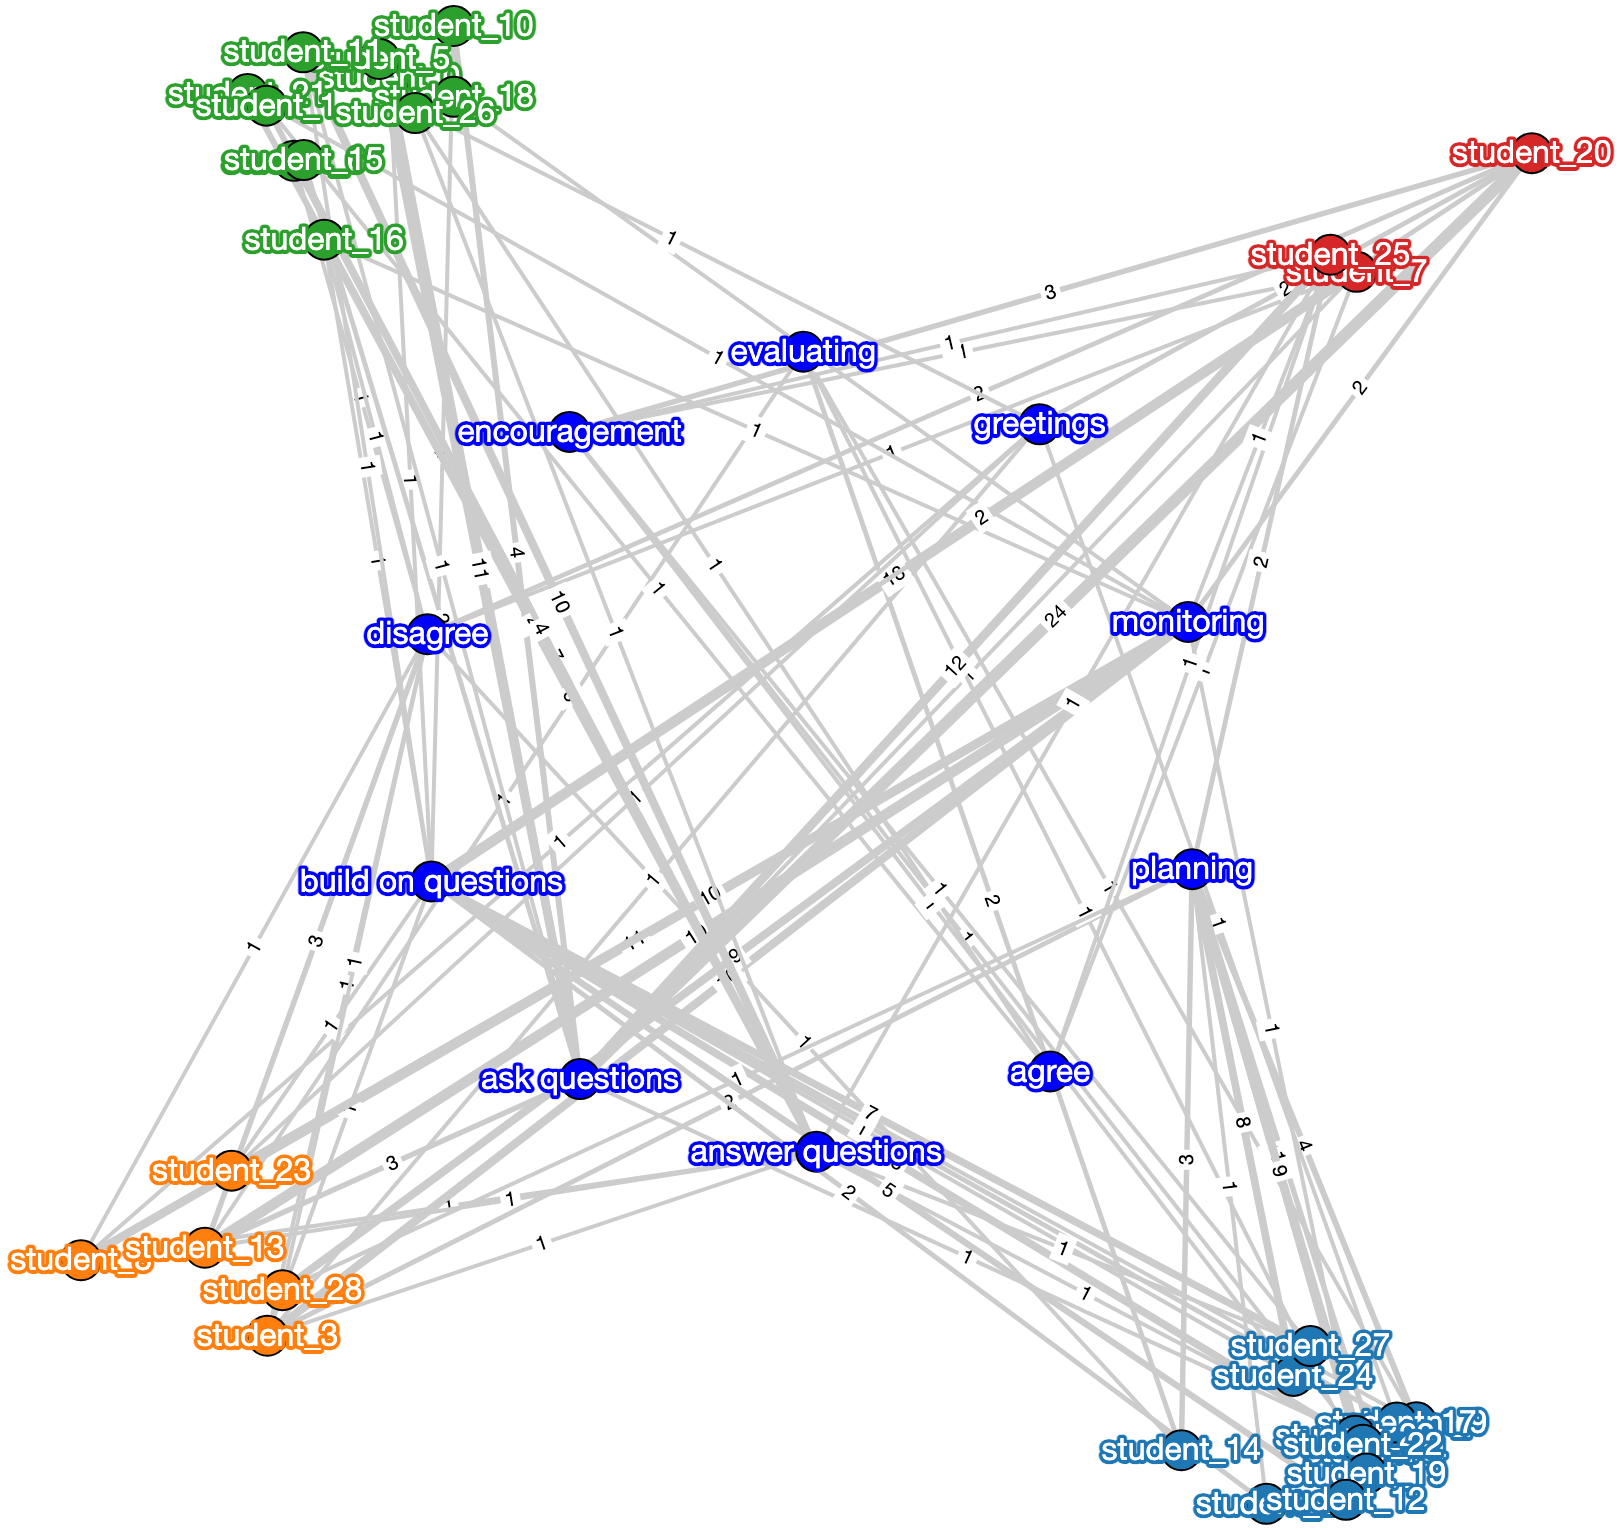
Bipartite clustering network with automatically inferred communities.
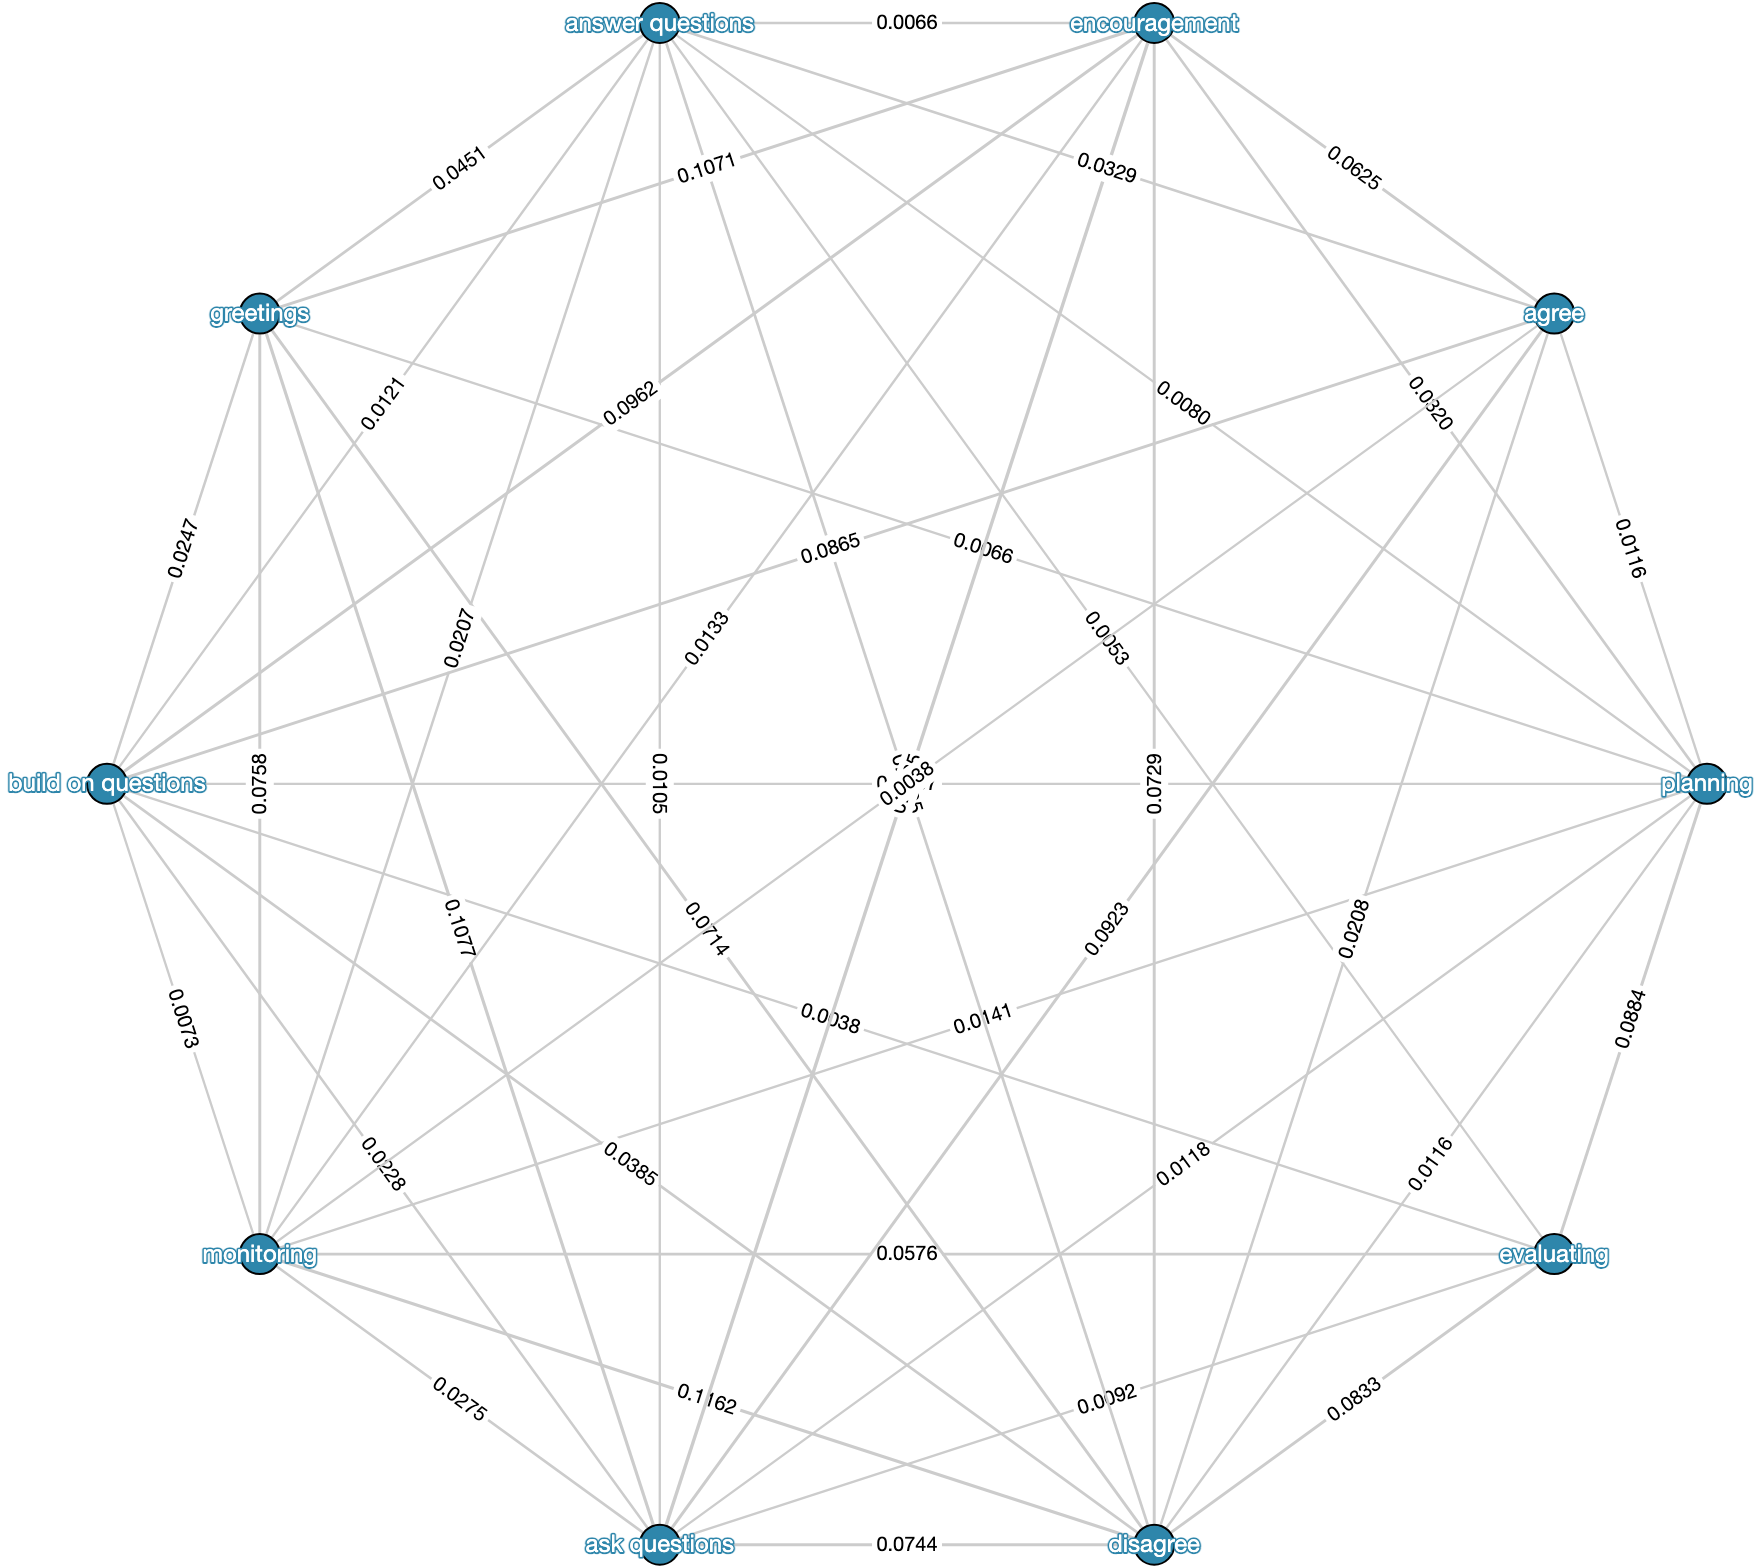
Projected one-mode network of the constructed HIN based on the object_col nodes
Paper Source
If you use these visualization functions in your work, please cite:
Feng, S., Gibson, D., & Gasevic, D. (2025). Analyzing students’ emerging roles based on quantity and heterogeneity of individual contributions in small group online collaborative learning using bipartite network analysis. Journal of Learning Analytics, 12(1), 253–270.